You have skipped the navigation, tab for page content


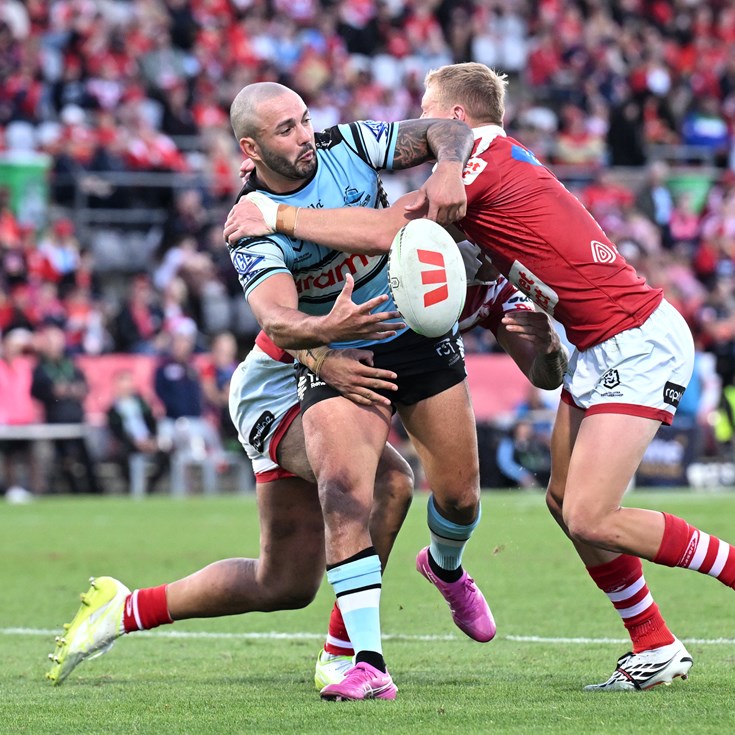
Braydon Trindall
Five-Eighth
Player Bio
- Height:
- 180 cm
- Date of Birth:
- 11 July 1999
- Weight:
- 90 kg
- Birthplace:
- Wee Waa, NSW
- Age:
- 27
- Nickname:
- -
- Debut Club:
- Cronulla-Sutherland Sharks
- Date:
- 31 July 2020
- Opposition:
- Brisbane Broncos
- Round:
- 12
- Previous Club:
- -
- Junior Club:
- Caboolture Snakes
- Biography:
Hailing from Wee Waa, Trindall has established himself as one of the NRL's most creative playmakers since his debut in 2020. Blessed with a booming boot, the five-eighth won Jersey Flegg and NSW Cup premierships on his way to becoming a first-grade fixture.
Career
- Appearances
- 114
- Tries
- 36
2026 Season
- Appearances
- 17
Scoring
- Tries
- 8
- Goals
- 10
Kicking
- Forced Drop Outs
- 20
- Average Kicking Metres
- 455.2
- Goal Conversion Rate
-
Attack
- Try Assists
- 23
- Line Break Assists
- 15
Passing
- Offloads
- 7
- Receipts
- 907
Defence
- Tackles Made
- 221
- Tackle Efficiency
-
Running Metres
- Average Running Metres
- 41
- Total Running Metres
- 700
Fantasy
- Total Points
- 824
- Average Points
- 48.5
2026 Season - By Round
| Round | Opponent | Score | Position | Minutes Played | Tries | Goals | 1 Point Field Goals | 2 Point Field Goals | Points | Kicking Metres | Forced Drop Outs | Try Assists | Linebreaks | Tackle Breaks | Post Contact Metres | Offloads | Receipts | Tackles Made | Missed Tackles | Total Running Metres | Hit Up Running Metres | Kick Return Metres | |
|---|---|---|---|---|---|---|---|---|---|---|---|---|---|---|---|---|---|---|---|---|---|---|---|
| 1 | Titans | Won | 50 - 10 | Five-Eighth | 80 | 2 | - | - | - | 8 | 376 | 1 | 4 | 1 | 1 | 2 | - | 52 | 6 | 1 | 55 | - | - |
| 2 | Panthers | Lost | 26 - 6 | Five-Eighth | 80 | - | - | - | - | - | 467 | 1 | - | - | 1 | 5 | - | 49 | 10 | 1 | 36 | - | - |
| 3 | Dolphins | Lost | 10 - 38 | Five-Eighth | 80 | 1 | - | - | - | 4 | 444 | 2 | - | 1 | 2 | 1 | 1 | 59 | 17 | 2 | 46 | - | - |
| 4 | Raiders | Won | 22 - 34 | Five-Eighth | 80 | - | - | - | - | - | 441 | 2 | 2 | - | 3 | 16 | 2 | 54 | 12 | 5 | 70 | - | - |
| 5 | Warriors | Won | 36 - 22 | Five-Eighth | 80 | - | - | - | - | - | 438 | 1 | 1 | - | 1 | 13 | - | 44 | 15 | 2 | 59 | - | - |
| 6 | Roosters | Lost | 22 - 34 | Five-Eighth | 80 | 1 | - | - | - | 4 | 366 | 1 | - | 1 | 1 | 5 | 1 | 49 | 15 | 3 | 38 | - | - |
| 8 | Cowboys | Lost | 46 - 34 | Five-Eighth | 80 | - | - | - | - | - | 364 | - | - | - | - | 5 | - | 43 | 10 | 3 | 10 | - | - |
| 9 | Wests Tigers | Won | 52 - 10 | Five-Eighth | 80 | - | - | - | - | - | 452 | 4 | 3 | 1 | - | 12 | 1 | 55 | 12 | 2 | 50 | 15 | - |
| 10 | Rabbitohs | Lost | 36 - 12 | Five-Eighth | 80 | - | - | - | - | - | 511 | - | - | - | 1 | 5 | - | 58 | 23 | 3 | 43 | - | - |
| 11 | Bulldogs | Won | 38 - 16 | Five-Eighth | 80 | 1 | - | - | - | 4 | 571 | 1 | 2 | - | - | - | - | 55 | 11 | 3 | - | - | - |
| 13 | Sea Eagles | Won | 28 - 22 | Five-Eighth | 80 | 1 | 3 | - | - | 10 | 602 | 2 | 3 | 1 | 1 | 6 | - | 51 | 20 | 2 | 26 | - | - |
| 14 | Dragons | Won | 34 - 12 | Five-Eighth | 80 | 1 | 5 | - | - | 14 | 561 | 1 | - | 1 | 1 | 1 | - | 53 | 12 | 2 | 25 | - | - |
| 15 | Warriors | Won | 8 - 10 | Five-Eighth | 80 | - | 2 | - | 1 | 6 | 550 | 4 | 1 | - | 1 | 6 | 1 | 61 | 9 | 2 | 29 | - | - |
| 16 | Roosters | Lost | 27 - 8 | Five-Eighth | 80 | - | - | - | - | - | 328 | - | 1 | - | - | 12 | - | 49 | 13 | 2 | 49 | - | - |
| 18 | Broncos | Won | 16 - 28 | Five-Eighth | 80 | 1 | - | - | - | 4 | 424 | - | 1 | - | - | 5 | - | 65 | 17 | 1 | 92 | - | - |
| 19 | Dolphins | Won | 0 - 66 | Five-Eighth | 80 | - | - | - | - | - | 523 | - | 3 | - | 1 | - | 1 | 57 | 11 | - | 48 | - | - |
| 20 | Knights | Won | 20 - 18 | Five-Eighth | 80 | - | - | - | - | - | 319 | - | 2 | - | - | 4 | - | 53 | 8 | 3 | 17 | - | - |
Career By Season
| Year | Played | Won | Lost | Drawn | Win % | Tries | Goals | 1 Point Field Goals | 2 Point Field Goals | Points | Kicking Metres | Kicking Metres Average | Goal Conversion Rate | Forced Drop Outs | Try Assists | Offloads | Receipts | Tackles Made | Missed Tackles | Tackle Efficiency | Total Running Metres | Average Running Metres | Kick Return Metres | Total Points | Average Points | |
|---|---|---|---|---|---|---|---|---|---|---|---|---|---|---|---|---|---|---|---|---|---|---|---|---|---|---|
| Sharks | 2020 | 5 | 2 | 3 | - | 40% | - | 4 | - | - | 8 | 722 | 144.36 | 66.67% | 2 | 1 | 2 | 196 | 95 | 21 | 81.90% | 204 | 40.00 | - | 133 | 26.6 |
| Sharks | 2021 | 18 | 9 | 9 | - | 50% | 4 | 36 | - | - | 88 | 2,846 | 158.11 | 81.82% | 9 | 9 | 6 | 586 | 206 | 53 | 79.54% | 914 | 50.00 | 15 | 634 | 35.2 |
| Sharks | 2022 | 15 | 11 | 4 | - | 73% | 1 | 2 | - | - | 8 | 823 | 54.84 | 33.33% | 2 | 4 | 3 | 262 | 141 | 24 | 85.45% | 446 | 29.00 | 11 | 230 | 15.3 |
| Sharks | 2023 | 13 | 7 | 6 | - | 54% | 4 | 13 | - | - | 42 | 3,221 | 247.79 | 72.22% | 4 | 6 | 2 | 481 | 168 | 39 | 81.16% | 649 | 49.00 | 101 | 426 | 32.8 |
| Sharks | 2024 | 20 | 11 | 9 | - | 55% | 12 | 29 | - | - | 106 | 6,761 | 338.03 | 74.36% | 9 | 18 | 4 | 929 | 248 | 61 | 80.26% | 1,070 | 53.00 | 36 | 774 | 38.7 |
| Sharks | 2025 | 26 | 16 | 10 | - | 62% | 7 | 3 | 3 | - | 37 | 9,746 | 374.85 | 75.00% | 12 | 19 | 3 | 1,283 | 320 | 64 | 83.33% | 1,080 | 41.00 | 74 | 863 | 33.2 |
| Sharks | 2026 | 17 | 11 | 6 | - | 65% | 8 | 10 | - | 1 | 54 | 7,739 | 455.22 | 71.43% | 20 | 23 | 7 | 907 | 221 | 37 | 85.66% | 700 | 41.00 | - | 824 | 48.5 |
Career Overall
| Year Start | Year End | Played | Won | Lost | Drawn | Win % | Tries | Goals | 1 Point Field Goals | 2 Point Field Goals | Points | Kicking Metres | Kicking Metres Average | Goal Conversion Rate | Forced Drop Outs | Try Assists | Offloads | Receipts | Tackles Made | Missed Tackles | Tackle Efficiency | Total Running Metres | Average Running Metres | Kick Return Metres | Total Points | Average Points | |
|---|---|---|---|---|---|---|---|---|---|---|---|---|---|---|---|---|---|---|---|---|---|---|---|---|---|---|---|
| Sharks | 2020 | 2026 | 114 | 67 | 47 | - | 59% | 36 | 97 | 3 | 1 | 343 | 31,857 | 256.91 | 74.05% | 58 | 80 | 27 | 4,644 | 1,399 | 299 | 82.39% | 5,065 | 40.00 | 239 | 3,884 | 34.1 |
Latest

Team Mates


Cronulla-Sutherland Sharks respect and honour the Traditional Custodians of the land and pay our respects to their Elders past, present and future. We acknowledge the stories, traditions and living cultures of Aboriginal and Torres Strait Islander peoples on the lands we meet, gather and play on.