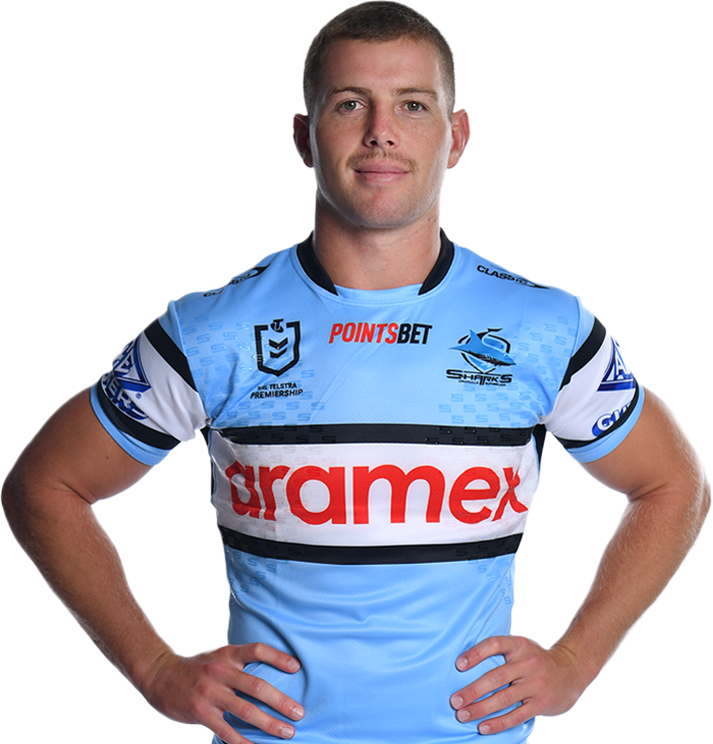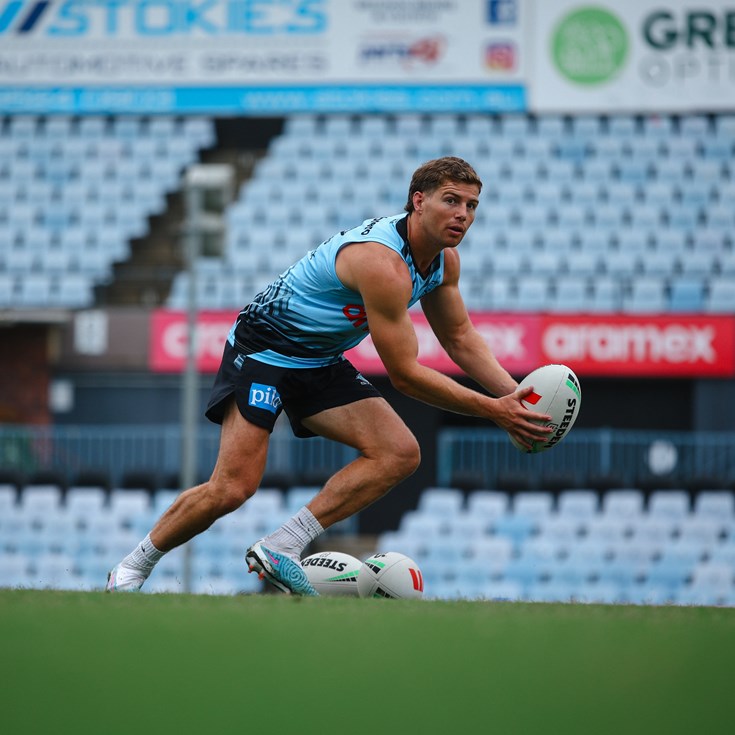

Blayke Brailey
Hooker
Player Bio
- Height:
- 180 cm
- Date of Birth:
- 23 September 1998
- Weight:
- 80 kg
- Birthplace:
- Sydney, NSW
- Age:
- 25
- Nickname:
- -
- Debut Club:
- Cronulla-Sutherland Sharks
- Date:
- 15 March 2019
- Opposition:
- Newcastle Knights
- Round:
- 1
- Previous Club:
- -
- Junior Club:
- Aquinas Colts
- Biography:
The crafty hooker has owned the number nine jersey since his brother Jayden's departure to the Knights ahead of the 2020 season. A local junior, Brailey has been in the Sharks development system since he was 13. The former Australian Schoolboy’s inclusion in the 2021 NSW Pathways squad, then as a member of the NSW Origin training squad ahead of game one of the 2023 series, indicates his ability and potential. The tackling machine won the 2023 Porter Gallen Medal as the team's Player of the Year.
Career
- Appearances
- 127
- Tries
- 15
2024 Season
- Appearances
- 17
Scoring
- Tries
- 3
Kicking
- Forced Drop Outs
- 0
- Average Kicking Metres
- 8.1
Attack
- Try Assists
- 5
- Line Break Assists
- 4
Passing
- Offloads
- 5
- Receipts
- 2127
Defence
- Tackles Made
- 704
- Tackle Efficiency
-
Running Metres
- Average Running Metres
- 40
- Total Running Metres
- 689
Fantasy
- Total Points
- 770
- Average Points
- 45.3
2024 Season - By Round
| Round | Opponent | Score | Position | Minutes Played | Tries | Goals | 1 Point Field Goals | 2 Point Field Goals | Points | Kicking Metres | Try Assists | Linebreaks | Tackle Breaks | Post Contact Metres | Offloads | Receipts | Tackles Made | Missed Tackles | Total Running Metres | Hit Up Running Metres | Kick Return Metres | |
|---|---|---|---|---|---|---|---|---|---|---|---|---|---|---|---|---|---|---|---|---|---|---|
| 1 | Warriors | Won | 12 - 16 | Hooker | 80 | - | - | - | - | - | - | - | - | 2 | 6 | - | 113 | 41 | 4 | 19 | - | - |
| 2 | Bulldogs | Won | 25 - 6 | Hooker | 80 | - | - | - | - | - | - | - | - | - | 11 | 1 | 147 | 38 | - | 48 | - | - |
| 3 | Wests Tigers | Lost | 32 - 6 | Hooker | 80 | - | - | - | - | - | - | 1 | - | 1 | 6 | - | 105 | 47 | 3 | 27 | - | - |
| 4 | Raiders | Won | 36 - 22 | Hooker | 80 | 1 | - | - | - | 4 | 38 | - | - | - | 4 | - | 131 | 42 | 1 | 49 | 4 | - |
| 6 | Rabbitohs | Won | 22 - 34 | Hooker | 80 | 1 | - | - | - | 4 | - | - | 1 | 2 | 10 | - | 135 | 45 | 2 | 73 | - | - |
| 7 | Cowboys | Won | 42 - 6 | Hooker | 80 | - | - | - | - | - | 23 | 1 | - | 1 | 10 | 1 | 153 | 35 | 2 | 18 | 1 | - |
| 8 | Raiders | Won | 0 - 40 | Hooker | 80 | - | - | - | - | - | - | - | - | 1 | 13 | - | 124 | 53 | 6 | 57 | 22 | - |
| 9 | Dragons | Won | 20 - 10 | Hooker | 80 | - | - | - | - | - | 27 | 1 | - | - | 10 | - | 142 | 40 | 2 | 46 | 18 | - |
| 10 | Storm | Won | 18 - 25 | Halfback | 80 | - | - | - | - | - | - | - | - | 1 | 8 | - | 136 | 20 | - | 46 | - | - |
| 11 | Roosters | Won | 38 - 30 | Hooker | 80 | - | - | - | - | - | - | - | - | 1 | 3 | - | 121 | 36 | 3 | 35 | - | - |
| 12 | Panthers | Lost | 0 - 42 | Hooker | 80 | - | - | - | - | - | - | - | - | 1 | 1 | - | 100 | 34 | 3 | 9 | - | - |
| 13 | Eels | Lost | 34 - 22 | Hooker | 80 | - | - | - | - | - | 47 | - | - | - | 8 | - | 114 | 55 | 3 | 35 | 11 | - |
| 14 | Broncos | Won | 12 - 22 | Hooker | 80 | 1 | - | - | - | 4 | 3 | - | - | - | 11 | - | 142 | 32 | 5 | 73 | - | - |
| 15 | Dolphins | Lost | 28 - 30 | Hooker | 80 | - | - | - | - | - | - | 1 | - | - | - | - | 102 | 53 | 3 | - | - | - |
| 17 | Bulldogs | Lost | 15 - 14 | Hooker | 84 | - | - | - | - | - | - | - | - | - | 13 | 2 | 140 | 54 | 2 | 38 | - | - |
| 18 | Titans | Lost | 16 - 20 | Hooker | 80 | - | - | - | - | - | - | - | - | 1 | 5 | - | 104 | 43 | 6 | 29 | - | - |
| 19 | Wests Tigers | Won | 58 - 6 | Hooker | 80 | - | - | - | - | - | - | 1 | - | 2 | 24 | 1 | 118 | 36 | - | 81 | 2 | - |
Career By Season
| Year | Played | Won | Lost | Drawn | Win % | Tries | Goals | 1 Point Field Goals | 2 Point Field Goals | Points | Kicking Metres | Kicking Metres Average | Goal Conversion Rate | Forced Drop Outs | Try Assists | Offloads | Receipts | Tackles Made | Missed Tackles | Tackle Efficiency | Total Running Metres | Average Running Metres | Kick Return Metres | Total Points | Average Points | |
|---|---|---|---|---|---|---|---|---|---|---|---|---|---|---|---|---|---|---|---|---|---|---|---|---|---|---|
| Sharks | 2019 | 15 | 7 | 8 | - | 47% | 2 | - | - | - | 8 | 82 | 5.49 | - | 1 | 1 | - | 640 | 248 | 13 | 95.02% | 165 | 11.00 | - | 271 | 18.1 |
| Sharks | 2020 | 20 | 10 | 10 | - | 50% | 4 | - | - | - | 16 | 547 | 27.37 | - | 5 | 6 | 7 | 2,039 | 729 | 44 | 94.31% | 861 | 43.00 | - | 876 | 43.8 |
| Sharks | 2021 | 24 | 10 | 14 | - | 42% | 2 | - | - | - | 8 | 536 | 22.33 | - | 2 | 5 | 12 | 2,840 | 956 | 76 | 92.64% | 1,002 | 41.00 | - | 1,052 | 43.8 |
| Sharks | 2022 | 26 | 18 | 8 | - | 69% | 3 | - | - | - | 12 | 473 | 18.19 | - | 3 | 9 | 6 | 3,064 | 1,127 | 60 | 94.95% | 1,125 | 43.00 | 16 | 1,277 | 49.1 |
| Sharks | 2023 | 25 | 14 | 11 | - | 56% | 1 | - | - | - | 4 | 192 | 7.68 | - | 2 | 10 | 9 | 2,963 | 1,057 | 90 | 92.15% | 1,171 | 46.00 | - | 1,133 | 45.3 |
| Sharks | 2024 | 17 | 11 | 6 | - | 65% | 3 | - | - | - | 12 | 137 | 8.07 | - | - | 5 | 5 | 2,127 | 704 | 45 | 93.99% | 689 | 40.00 | - | 770 | 45.3 |
Career Overall
| Year Start | Year End | Played | Won | Lost | Drawn | Win % | Tries | Goals | 1 Point Field Goals | 2 Point Field Goals | Points | Kicking Metres | Kicking Metres Average | Goal Conversion Rate | Forced Drop Outs | Try Assists | Offloads | Receipts | Tackles Made | Missed Tackles | Tackle Efficiency | Total Running Metres | Average Running Metres | Kick Return Metres | Total Points | Average Points | |
|---|---|---|---|---|---|---|---|---|---|---|---|---|---|---|---|---|---|---|---|---|---|---|---|---|---|---|---|
| Sharks | 2019 | 2024 | 127 | 70 | 57 | - | 55% | 15 | - | - | - | 60 | 1,968 | 15.50 | - | 13 | 36 | 39 | 13,673 | 4,821 | 328 | 93.63% | 5,016 | 39.00 | 16 | 5,379 | 42.4 |
Latest
Team Mates

Cronulla-Sutherland Sharks respect and honour the Traditional Custodians of the land and pay our respects to their Elders past, present and future. We acknowledge the stories, traditions and living cultures of Aboriginal and Torres Strait Islander peoples on the lands we meet, gather and play on.


