You have skipped the navigation, tab for page content


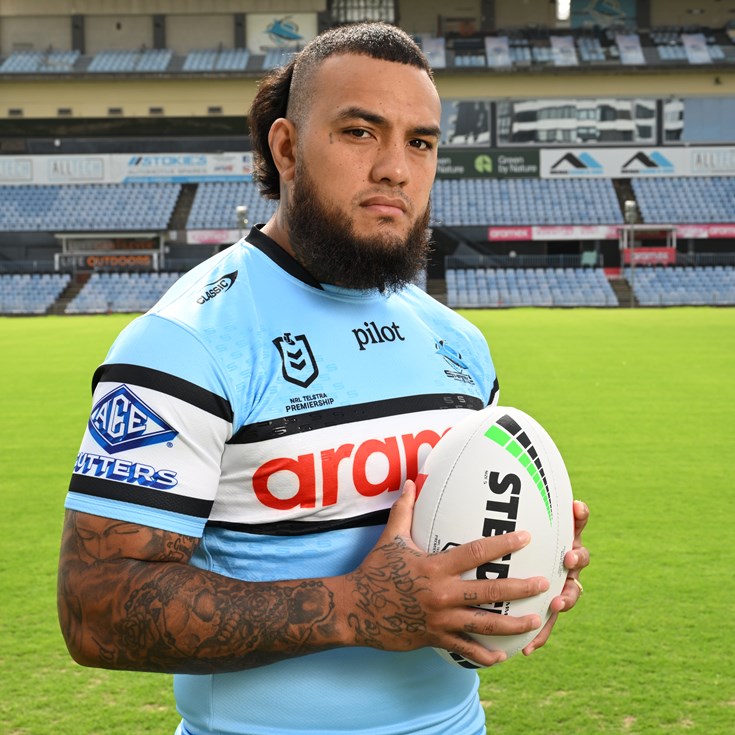
Addin Fonua-Blake
Prop
Player Bio
- Height:
- 189 cm
- Date of Birth:
- 06 November 1995
- Weight:
- 123 kg
- Birthplace:
- Meadowbank, NSW
- Age:
- 30
- Nickname:
- -
- Debut Club:
- Manly-Warringah Sea Eagles
- Date:
- 14 April 2016
- Opposition:
- Parramatta Eels
- Round:
- 7
- Previous Clubs:
- Manly-Warringah Sea Eagles, New Zealand Warriors
- Junior Club:
- -
- Biography:
A world-class prop with a potent blend of aggression, power, stamina and skill, Fonua-Blake won Cronulla's 2025 Player of the Year award in his first season at the club. Renowned for his leadership and presence, he has proudly captained Tonga on the international stage.
Career
- Appearances
- 213
- Tries
- 38
2026 Season
- Appearances
- 4
Scoring
- Tries
- 0
Attack
- Tackle Breaks
- 9
- Average Hit Ups
- 11.2
- Post Contact Metres
- 255.3
Passing
- Offloads
- 1
Defence
- Tackles Made
- 115
- Tackle Efficiency
-
Running Metres
- Average Running Metres
- 153
- Total Running Metres
- 614
Fantasy
- Total Points
- 183
- Average Points
- 45.8
2026 Season - By Round
| Round | Opponent | Score | Position | Minutes Played | Tries | Goals | 1 Point Field Goals | 2 Point Field Goals | Points | Try Assists | Linebreaks | Tackle Breaks | Post Contact Metres | Offloads | Receipts | Tackles Made | Missed Tackles | Total Running Metres | Hit Up Running Metres | Kick Return Metres | |
|---|---|---|---|---|---|---|---|---|---|---|---|---|---|---|---|---|---|---|---|---|---|
| 1 | Titans | Won | 50 - 10 | Prop | 53 | - | - | - | - | - | - | - | 3 | 80 | 1 | 19 | 28 | 1 | 200 | 159 | 35 |
| 2 | Panthers | Lost | 26 - 6 | Prop | 54 | - | - | - | - | - | - | - | 1 | 43 | - | 13 | 28 | 1 | 99 | 99 | - |
| 3 | Dolphins | Lost | 10 - 38 | Prop | 59 | - | - | - | - | - | - | - | 2 | 46 | - | 11 | 39 | 1 | 91 | 91 | - |
| 4 | Raiders | Won | 22 - 34 | Prop | 52 | - | - | - | - | - | - | - | 3 | 85 | - | 19 | 20 | 2 | 222 | 120 | 84 |
Career By Season
| Year | Played | Won | Lost | Drawn | Win % | Tries | Goals | 1 Point Field Goals | 2 Point Field Goals | Points | Kicking Metres | Kicking Metres Average | Forced Drop Outs | Tackle Breaks | Post Contact Metres | Offloads | Tackles Made | Missed Tackles | Tackle Efficiency | Total Running Metres | Average Running Metres | Kick Return Metres | Total Points | Average Points | |
|---|---|---|---|---|---|---|---|---|---|---|---|---|---|---|---|---|---|---|---|---|---|---|---|---|---|
| Sea Eagles | 2016 | 14 | 4 | 10 | - | 29% | 2 | - | - | - | 8 | - | - | - | 17 | 426 | 8 | 215 | 8 | 91.10% | 1,001 | 71.00 | 108 | 372 | 26.6 |
| Sea Eagles | 2017 | 22 | 12 | 10 | - | 55% | - | - | - | - | - | - | - | - | 55 | 926 | 5 | 355 | 21 | 94.41% | 2,079 | 94.00 | 435 | 651 | 29.6 |
| Sea Eagles | 2018 | 24 | 7 | 17 | - | 29% | 3 | - | - | - | 12 | 17 | 0.71 | 1 | 71 | 1,237 | 13 | 535 | 35 | 93.86% | 2,979 | 124.00 | 625 | 960 | 40.0 |
| Sea Eagles | 2019 | 22 | 14 | 8 | - | 64% | 5 | - | - | - | 20 | - | - | - | 76 | 1,400 | 33 | 545 | 21 | 96.29% | 3,591 | 163.00 | 582 | 1,159 | 52.7 |
| Sea Eagles | 2020 | 15 | 6 | 9 | - | 40% | 3 | - | - | - | 12 | - | - | - | 34 | 1,125 | 12 | 384 | 9 | 97.71% | 2,498 | 166.00 | 311 | 737 | 49.1 |
| Warriors | 2021 | 15 | 4 | 11 | - | 27% | 1 | - | - | - | 4 | - | - | - | 33 | 1,054 | 20 | 393 | 13 | 96.80% | 2,257 | 150.00 | 410 | 745 | 49.7 |
| Warriors | 2022 | 21 | 6 | 15 | - | 29% | 1 | - | - | - | 4 | - | - | - | 38 | 1,486 | 11 | 523 | 19 | 96.49% | 3,232 | 153.00 | 409 | 916 | 43.6 |
| Warriors | 2023 | 26 | 17 | 9 | - | 65% | 9 | - | - | - | 36 | - | - | - | 73 | 1,668 | 35 | 714 | 33 | 95.58% | 4,451 | 171.00 | 610 | 1,453 | 55.9 |
| Warriors | 2024 | 23 | 8 | 14 | 1 | 35% | 8 | - | - | - | 32 | 2 | 0.07 | - | 84 | 1,698 | 24 | 630 | 27 | 95.89% | 4,030 | 175.00 | 640 | 1,330 | 57.8 |
| Sharks | 2025 | 27 | 17 | 10 | - | 63% | 6 | - | - | - | 24 | - | - | - | 74 | 1,931 | 17 | 767 | 31 | 96.12% | 4,345 | 160.00 | 345 | 1,392 | 51.6 |
| Sharks | 2026 | 4 | 2 | 2 | - | 50% | - | - | - | - | - | - | - | - | 9 | 255 | 1 | 115 | 5 | 95.83% | 614 | 153.00 | 119 | 183 | 45.8 |
Career Overall
| Year Start | Year End | Played | Won | Lost | Drawn | Win % | Tries | Goals | 1 Point Field Goals | 2 Point Field Goals | Points | Kicking Metres | Kicking Metres Average | Forced Drop Outs | Tackle Breaks | Post Contact Metres | Offloads | Tackles Made | Missed Tackles | Tackle Efficiency | Total Running Metres | Average Running Metres | Kick Return Metres | Total Points | Average Points | |
|---|---|---|---|---|---|---|---|---|---|---|---|---|---|---|---|---|---|---|---|---|---|---|---|---|---|---|
| Sea Eagles | 2016 | 2020 | 97 | 43 | 54 | - | 44% | 13 | - | - | - | 52 | 17 | 0.18 | 1 | 252 | 5,101 | 71 | 2,033 | 94 | 95.58% | 12,122 | 124.00 | 2,063 | 3,872 | 39.9 |
| Warriors | 2021 | 2024 | 85 | 35 | 49 | 1 | 41% | 19 | - | - | - | 76 | 2 | 0.02 | - | 228 | 5,906 | 90 | 2,260 | 92 | 96.09% | 13,971 | 164.00 | 2,070 | 4,444 | 52.3 |
| Sharks | 2025 | 2026 | 31 | 19 | 12 | - | 61% | 6 | - | - | - | 24 | - | - | - | 83 | 2,186 | 18 | 882 | 36 | 96.08% | 4,959 | 159.00 | 465 | 1,575 | 50.8 |
Latest


Team Mates


Cronulla-Sutherland Sharks respect and honour the Traditional Custodians of the land and pay our respects to their Elders past, present and future. We acknowledge the stories, traditions and living cultures of Aboriginal and Torres Strait Islander peoples on the lands we meet, gather and play on.